Bibliometrics 文獻計量分析 is the use of statistical methods to analyze research literature to observe patterns of research publication data. The explosion of research publications has generated big bibliographical data, that has substantialized correlational analysis for observing patterns and trends of research publication such as CDL related research. Here below are a guidance of VOSviewer with few testing bibliometric samples related to CDL research presented by VOSviewer. (For information, CiteSpace is another bibliometric program recommended).
1. How to use VOSviewer Software
VOSviewer is a software which can provide such bibliographical analysis. created by Nees Jan van Eck and Ludo Waltman, researchers at the Centre for Science and Technology Studies (CWTS) of Leiden University in the Netherlands. For information, please view the creators’ presentations closely below:
- VOSviewer Website and Download (https://www.vosviewer.com/)
- Getting Started (video) (https://youtu.be/9dTWkNRxUtw) (2015) by VOSviewer creator(s)
- Visual exploration of scientific literature using VOSviewer and CitNetExplorer (video) (https://youtu.be/3aSKhFeXIU4) (7/2020) by VOSviewer creator(s)
- BIbliometric Analysis of DIMENSIONS Data Using VOSviewer (video) (https://youtu.be/or6LA0anOBQ) (3/2021) by Research Hub
2. Samples related to CDL research
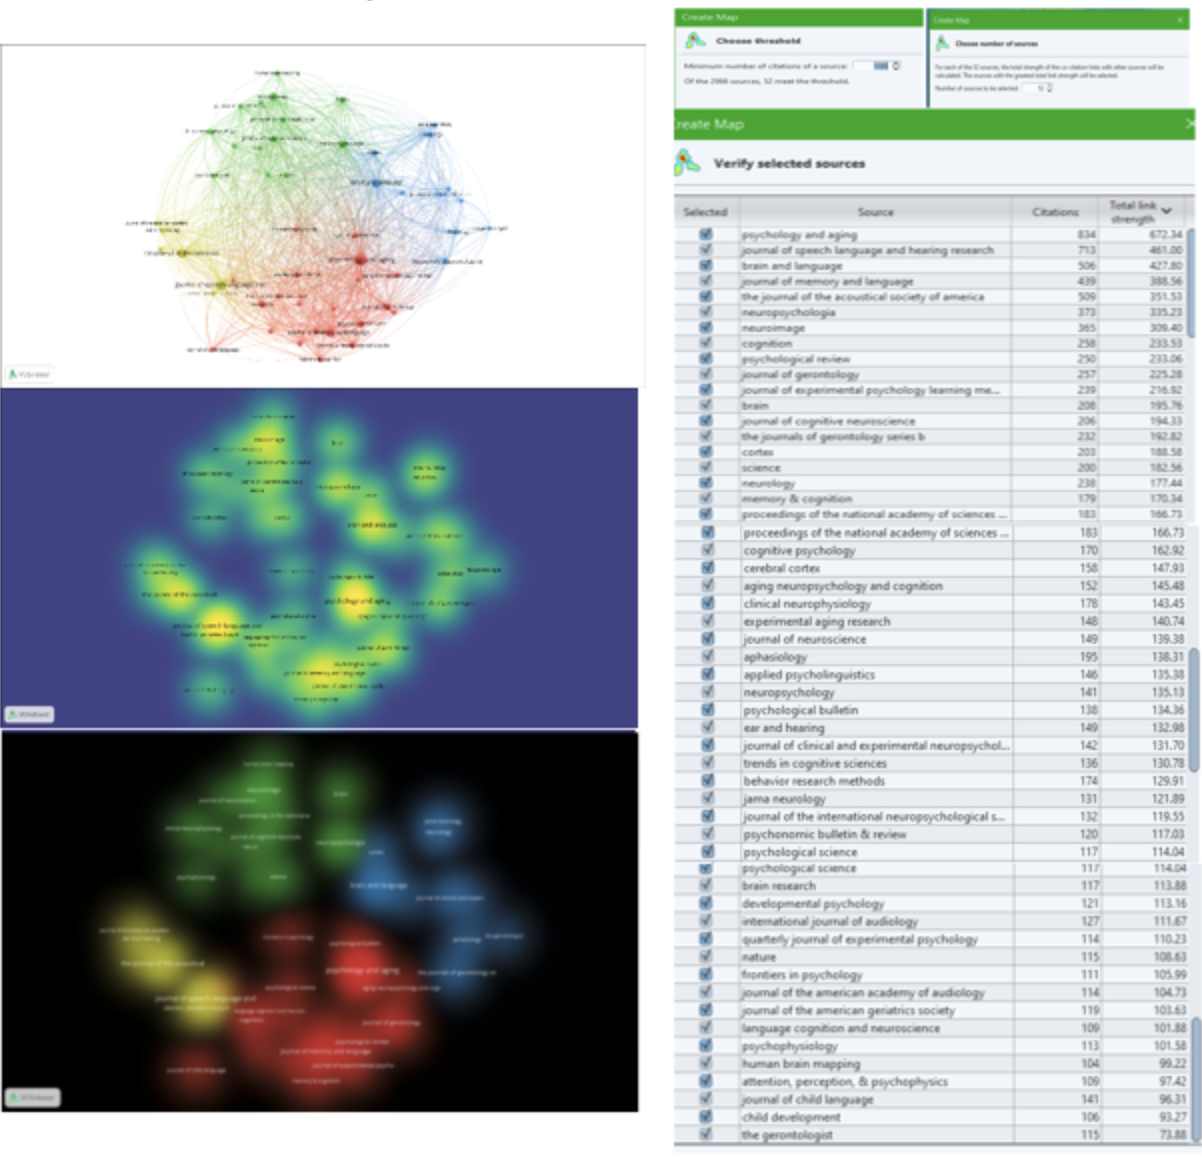
Sample: Co-Citation Source Analysis of the topic of “Aging and Linguistics”
Query: Co-Citation source with minimum number of citation 100 (Right figure)
Database: Dimensions (open database)
Tool of Bibliometric analysis and mapping: VOSviewer
Result (5/2021): 52 out of 2966 co-citation sources meet Query conditions (see Figure 4 for statistical data, see Figure 1-3 for data visualization)
Style of bibliometric visualizations:
- Interactive view (requirements)
- Statistic data (2 files): [map 100] [network 100]
- Instruction [view PDF]
- Screenshot view (Left figure)