- Home
- Students
- Project Showcase
- Communication Design
Communication Design
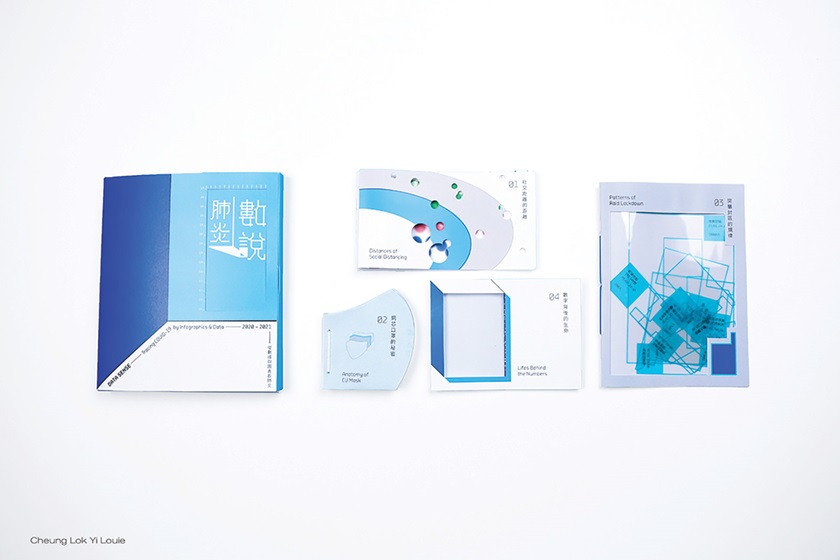
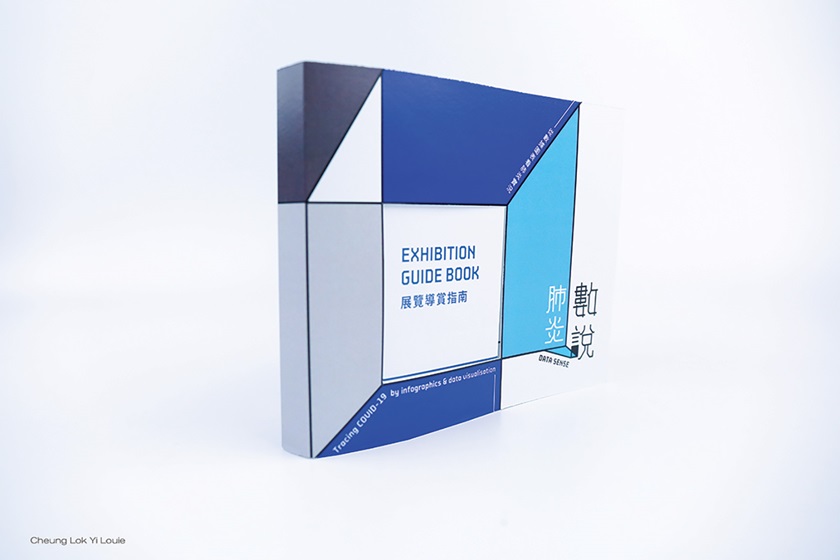
Data Sense: Tracing COVID-19 by infographics and data visualisation
by Cheung Lok Yi Louie
BA (Hons) in Communication Design
People in Hong Kong have been receiving large amounts of information and data about the pandemic. They seem to have become numb to numbers and data, such as confirmed cases or even death cases.
To avoid this situation, information design is one of the most effective ways of representing data. Through visualising data, readers can easily understand the real meaning behind it.
Tutor: Brian Kwok


