A demonstration of the correct interpretation of confidence intervals
What confidence intervals mean
I frequently notice people interpreting confidence intervals (CIs) incorrectly. This isn't just me;
Belia, Fidler, Williams, & Cumming (2005)
and Hoekstra, Morey, Rouder, & Wagemakers (2014)
have empirically documented how pervasive such misinterpretations are. For example, just today I encountered
someone in the ResearchGate question forum stating that a 95% CI means that, if you replicate an experiment 100 times
(drawing 100 new samples from the same population), about 95% of the means of these replication samples will fall within your
original CI. This is not true. What a 95% CI actually means is that, if you run the experiment 100
times and calculate a 95% CI for each one, about 95% of those 100 replication samples's CIs will include the actual population mean.
That all might sound very theoretical, so let's to put it another way, with an applied example.
Say you do a semantic priming experiment and find a semantic priming effect of 40 ms, with a 95% CI from 15 ms
to 65 ms. That does not mean that if you replicate it 100 times, 95 of the replications' mean priming effects will
be between 15 and 65 ms. It only means that if you run the experiment 100 times and calculate a 95% CI on each of those replications, about 95 of those 95% CIs will include
the "real" semantic priming effect, whatever that is. The CI actually gives you no explicit information about whether or not your
original sample actually contains the population mean (i.e., the "real" semantic priming effect), and thus it doesn't actually
tell you where the population mean falls. Nevertheless, we usually make the inference that, even though it's possible our
sample was one of the 5% of hypothetical samples that did not include the population mean, it is more likely that our
sample was one of the 95% that did; and, by extension, we make the inference that the population mean probably is within
our sample 95% CI, although we can't be sure. (Thus, while it's not technically true to say "There is a 95% chance that the
population mean falls within this 95% CI", it is fair to roughly treat the CI as a reasonable estimate for where we are
likely to think the population mean probably falls.)
Importantly, though, this is very different than claiming that 95% of replication
samples fall within our CI. It is actually possible to have a situation where very few of the replication samples fall in
our CI. Imagine a situation where the true semantic priming effect in the population is 0 ms (this might be
the case, for instance, with some type of very weak associative relationship, who knows), but any given sample (i.e.,
any given experiment) could show a larger- or smaller-than-zero effect because of sampling error. Maybe by sheer luck
we recruit a sample of 24 people and get a large priming effect of 40 ms with a 95% CI from 15 to 65 ms.
Because the population mean is 0, though, if we replicated the experiment 100 times on new samples, very few of the
priming effects we observe would fall within that CI. It would very likely be less than 95% of the samples.
A demonstration in R
You don't need to take my (and Belia et al.'s, and Hoekstra et al.'s) word for it; the beauty of a computer
is that we can actually create a fake population with some effect, and simulate a bunch of experiments from it, and use that
to see how CIs behave. Below is some R code that does exactly that.
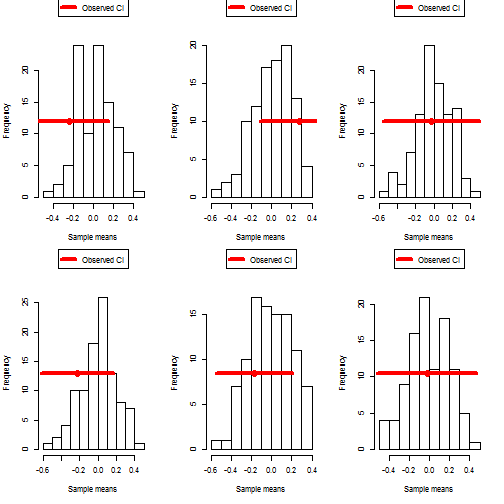
You can first look at the first chunk, which demonstrates
why it's incorrect to say a 95% CI means that 95% of replications will show effects falling within this CI. This code
chunk tests that (it takes a sample from the population, calculates a CI of its mean, and then takes a bunch more samples and sees how
many of their means fall within the original CI), and shows that it is often not the case. (If by sheer bad luck you run it and
all the simulations come out with 95% or more of the replication means falling in the original CI, just run it a few more times
and you should quickly get a lot of simulations with fewer than 95% of replication means falling in the original CI. My low
score so far is 24%.)
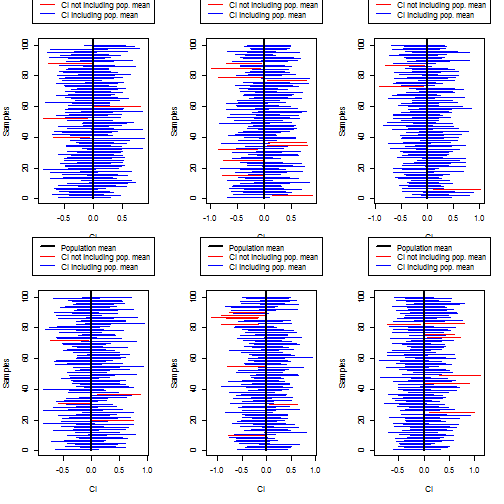
The second chunk then shows the correct interpretation of a CI. It takes a lot of samples (i.e., runs a lot
of experiments) and sees how many of their CIs contain the population mean, which we actually know since we created this fake
population. Of course, in a real experiment, the population is unknown, which is why we can't actually know if our experiment's
CI did or did not capture the real population mean (although we can make the kinds of rough inferences described above).
######################
### CI SIMULATIONS ###
######################

# Create a normally distributed population
population <- rnorm( 1000000 )

### INCORRECT DEFINITION OF CI
### The following code chunk uses simulations to show
### that it is not true that 95% of hypothetical samples
### will fall within the original observed CI

# A function to simulate one "real" experiment and multiple hypothetical experiments
simulate_experiments_wrong <- function( n_simulation, n_subj ){

        # Do an experiment: sample n_subj subjects from the population
        realsample <- sample( population, n_subj, replace=T )

        # Get the 95% CI of this sample
        CI.lengths <- sd( realsample ) / sqrt(n_subj) * qt( .975, n_subj-1 )
        realCI <- c( mean(realsample)-CI.lengths, mean(realsample)+CI.lengths )

        # Get n_simulation samples and their means, to compare against the "real" experiment
        newsamplemeans <- unlist( lapply( 1:n_simulation, function(x){ mean( sample( population, n_subj, replace=F ) ) } ) )

        # Make a histogram showing the original sample CI and the hypothetical sample means
        samplehist <- hist( newsamplemeans, xlab="Sample means", main=NA)
        lines( realCI, rep( max(samplehist$counts)/2, 2), col="red", lwd=4 )
        points( mean(realsample), max(samplehist$counts)/2, col="red", cex=2, pch=16 )
        legend( "top", col="red", lwd=4, legend="Observed CI", pch=16, xpd=NA, inset=-.25 )

        # Get the proportion which are within the original CI
        proportion_in_original_CI <- length( which( newsamplemeans>=realCI[1] & newsamplemeans<=realCI[2] ) ) / n_simulation

        # Show the results
        print( paste0( proportion_in_original_CI*100, "% of simulated experiments had a mean that fell within the sample CI (wrong definition)" ) )
}

# If you run this simulation over and over again, you will get a lot of values quite far from 95%
# Here let's do it 6 times
par(mfrow=c(2,3) )
for( i in 1:6 ){
        simulate_experiments_wrong( n_simulation=100, n_subj=24)
}
## [1] "72% of simulated experiments had a mean that fell within the sample CI (wrong definition)"
## [1] "74% of simulated experiments had a mean that fell within the sample CI (wrong definition)"
## [1] "99% of simulated experiments had a mean that fell within the sample CI (wrong definition)"
## [1] "81% of simulated experiments had a mean that fell within the sample CI (wrong definition)"
## [1] "85% of simulated experiments had a mean that fell within the sample CI (wrong definition)"
## [1] "100% of simulated experiments had a mean that fell within the sample CI (wrong definition)"

### CORRECT DEFINITION OF CI
### The following code chunk uses simulations to show that 95% of
### the hypothetical samples' CIs contain the population mean

# A function that simulates one hypothetical experiment and tests whether
# its confidence interval contains the real population mean
experiment <- function(population, n, conf.level){

        # Draw a sample from the population
        exp_sample <- sample( population, n )

        # Calculate the conf.level% CI
        CI.lengths <- sd( exp_sample ) / sqrt(n) * qt( mean(c(1,conf.level)), n-1 )
        CI <- c( mean(exp_sample)-CI.lengths, mean(exp_sample)+CI.lengths )

        # Return the sample CI)
        return( CI )
}

# A function to repeat that experiment many times and show how many of the
# sample CIs contained the population mean
simulate_experiments <- function( n_simulation ){

        # Simulate a bunch of experiments and get their sample CIs
        sampleCIs <- lapply( 1:n_simulation, function(x){experiment(population, 24, .95)} )

        # see which sample CIs include the population mean
        pop_mean_in_sample_CI <- unlist( lapply( sampleCIs, function(x){x[1]<=mean(population) & x[2]>=mean(population)} ) )

        # Create a plot of all the sample CIs.
        # Sample CIs that include the population mean will be in blue; sample CIs
        #	that don't include the population mean will be in red.
        lowerbounds <- unlist( lapply( sampleCIs, function(x){ x[1] } ) )
        upperbounds <- unlist( lapply( sampleCIs, function(x){ x[2] } ) )
        matplot( rbind(lowerbounds,upperbounds), rbind( 1:length(lowerbounds), 1:length(lowerbounds) ), type="l", col=ifelse( pop_mean_in_sample_CI, "blue", "red"), lty=1, lwd=1, ylab="Samples", xlab="CI" )
        lines( rep( mean(population),2 ), c(0, length(lowerbounds)+5 ), col="black", lwd=2 )
        legend( "top", col=c("black", "red", "blue"), lwd=c(2,1,1), legend=c("Population mean", "CI not including pop. mean", "CI including pop. mean"), xpd=NA, inset=-.325 )

        # Get the proportion of sample CIs that include the population mean, and show it on the screen
        proportion_CIs_including_popmean <- length(which(pop_mean_in_sample_CI))/length(pop_mean_in_sample_CI) * 100
        print( paste0( proportion_CIs_including_popmean, "% of simulated experiments contained the real population mean in their sample CIs (right definition)" ) )
}

# If you run this simulation over and over again (by pressing the 'up' key and running the following line again, repeatedly), you will repeatedly get values around 95%.
# The larger the value of n_simulation you use, the closer the results will be to 95% (but it
# will get slow to run)
# Here let's do it 6 times
par(mfrow=c(2,3) )
for( i in 1:6 ){
        simulate_experiments( n_simulation=100)
}
## [1] "96% of simulated experiments contained the real population mean in their sample CIs (right definition)"
## [1] "90% of simulated experiments contained the real population mean in their sample CIs (right definition)"
## [1] "97% of simulated experiments contained the real population mean in their sample CIs (right definition)"
## [1] "96% of simulated experiments contained the real population mean in their sample CIs (right definition)"
## [1] "92% of simulated experiments contained the real population mean in their sample CIs (right definition)"
## [1] "93% of simulated experiments contained the real population mean in their sample CIs (right definition)"

by Stephen Politzer-Ahles. Last modified on 2016-05-28.

